In 2021, we launched a survey among our community of lenders to gain a better insight into the topics they were eager to learn more about. One topic came back repeatedly: our statistics. To answer your questions related to statistics, we are continuing with our series of articles called October’s Data Dive.
In this third article, we will focus on a statistic that lenders are interested in: the default rate. We will take a closer look at what this means, how to understand it in our statistics page and how to check it in your portfolio.
Understanding the default rate
Before getting into the default rate, we are going to explain the definition of what a default is. In a nutshell, for a lender, a default occurs when a company does not repay one or more instalment on time.
Companies can experience ups and downs throughout their life cycle and they may face liquidity issues at some point during their growth. Therefore, when you lend to businesses, you assume the risk that some of your loans might go into default. Check out our repayment and recovery processes in detail here.
Therefore, the default rate would be the number of defaults relative to any given portfolio of loans.
Focus on default statistics
You can find the default rates on the October statistics page. They are available whenever you need them and they are updated monthly. On the page, we show the default indicators required by the French regulator, Autorité de contrôle prudentiel et de résolution (ACPR), for lending platforms. These indicators might be difficult for a lender to understand clearly.
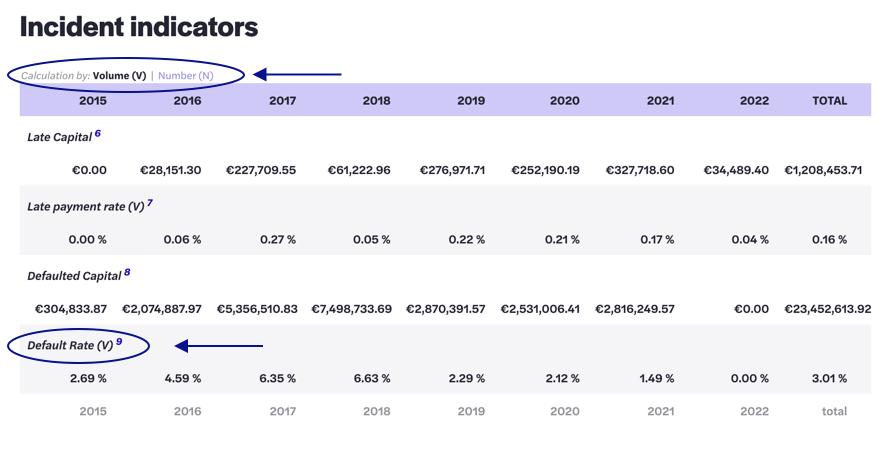
There are two tables: one about incidents and one about defaults. The differences between the ratios displayed on both tables lie in the denominator.
The table about incident indicators is split per year and takes into account all the projects financed on the platform. The second table about default indicators is split by projects grade and is based on the outstanding capital of the October portfolio, which means ongoing loans.
Therefore, the default indicators is calculated by dividing the total amount of defaults ever registered by October and compares it to the outstanding capital for each risk rating. With this method, the more October generates new loans, the more the default rates will decrease. In parallel, if October ceased all activities and no longer generated new loans, the default rate will increase until the outstanding is only composed of defaulted loans and the ratio reaches 100%.
Additionally, you can consult the incident and default indicators tables and select the way in which the default rate is calculated. The results could vary depending on the filter selected.
- By Volume (V): the calculation is made with the amount of capital borrowed, capital outstanding of delayed loans or capital outstanding in general.
- By Number (N): the calculation is made with the numbers of projects financed, projects delayed or outstanding loans in general.
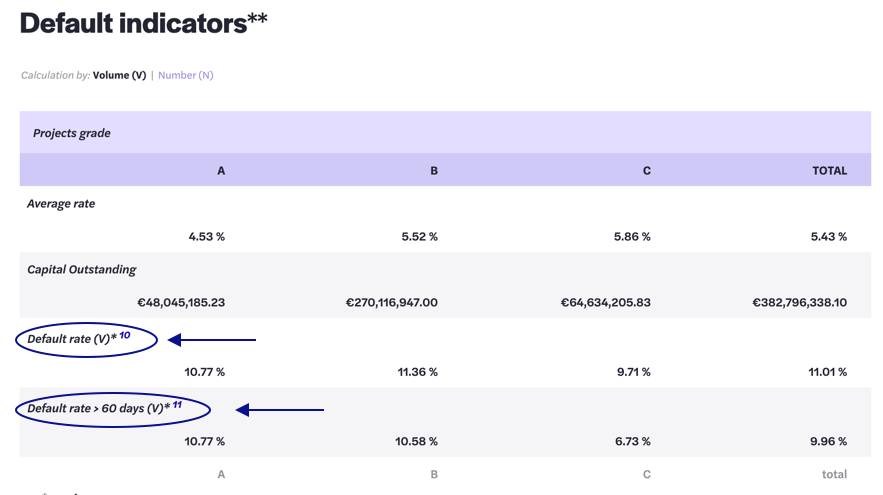
Let’s focus on the default rate according to the credit scores.
At October, the scoring model determines if the company project is doable or not. The credit score ranges from A+ to C- (from high to low creditworthiness). Therefore, the riskier a project is, the higher the interest rate will be and C projects have the highest interest rate. If you want to know more about our scoring model, take a look at our tutorial.
In the metric Default rate with more than 60 days (V) we can see that A projects represent 10.77% of the total defaults of the capital outstanding of loans globally, B projects 10.58% and C projects 6.73%.
To understand the default rate as a function of the credit scoring, we need to consider several points:
- First, the number of loans approved per credit rating. We have recently approved more C- rated loans than A or B projects. The overall C portfolio is therefore less mature and cannot have the same default rate as A or B projects. We have approved less of them in the past few months. The outstanding capital of those loans is still significantly larger than the default registered.
- The rescheduled projects are included in both the default rate*and the default rate for projects with more than 60 days late even though the vast majority of them continue to make monthly interest payments. In fact, 11% of defaults (in number of loans) are rescheduled projects and most of them were rescheduled because they are among the sectors most affected by Covid-19.
- Projects only open to the October fund are also included in the default rate. They represent 26,7% (in number of loans) of the number of projects in default.
Therefore, the default rate is the accumulation of the number of defaults since the beginning of October.
Calculating your own default rate
If you want to calculate your own default rate, here are the formulas:
- According to the number of project financed: Number of default/number of project financed
- According to your outstanding capital: Outstanding capital of your defaults / your capital outstanding.
As defaults are not representative of the health of your portfolio, we recommend you to have a look at your Internal Rate of Return (IRR) instead, which tells you if your portfolio is profitable or not. In fact, the most interesting statistic to analyse the impact of defaults on the October portfolio is the IRR (net of risk) and to compare it to the maximum possible IRR.
Read our article on the evolution & rentability of the portfolio to understand how to maintain a positive IRR even with defaults.
How can I check a default on my portfolio?
At the beginning of each month, the Operations team sends a direct debit for the monthly repayment to every borrower and checks if there are any issues. Once that process is completed, the repayments will then be sent to your account between the 15th and 20th of every month. in the case of a company failing to repay, you will receive a specific message explaining the situation and the recovery actions put in place.
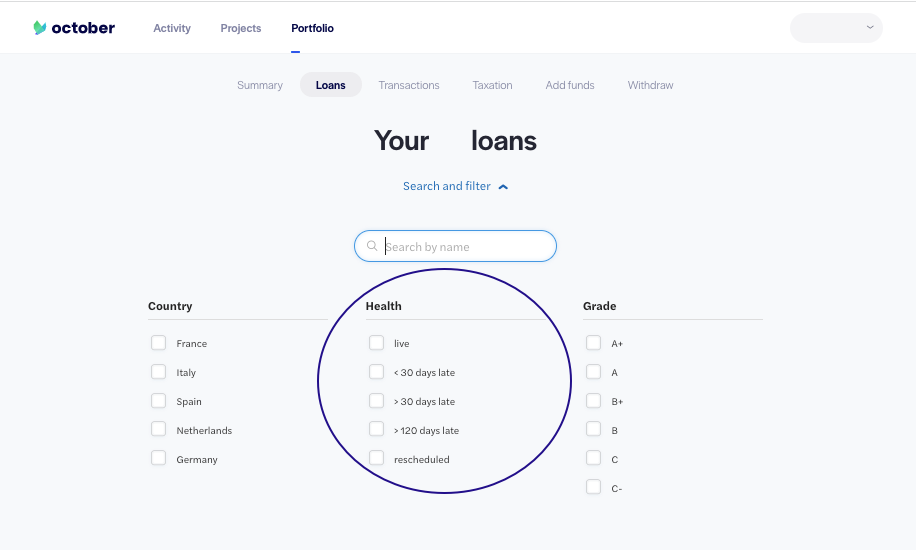
You can check your projects in default at any time. Simply go to your Portfolio, click on the Loans tab and start applying the filters on the “Health” part.
These are the 5 possible health statuses:
- Live: the company is repaying regularly.
- < 30 days late: the company has not repaid one monthly instalment.
- > 30 days late: the company has not repaid more than one monthly instalment or up to 5 monthly instalments.
- > 120 days late: the company has not repaid more than 5 monthly instalments or is in judicial procedure. In the case that the company is not in judicial procedure, October will proceed to the termination of the contract and we will pass the case to our external recovery agency to start the procedure.
- Rescheduled: the company suffers from liquidity stress, but is open to collaborate. The loan will be rescheduled to reduce the burden of the monthly repayments on the company’s schedule. Thereby, the company can continue with the repayments and recover from its situation.
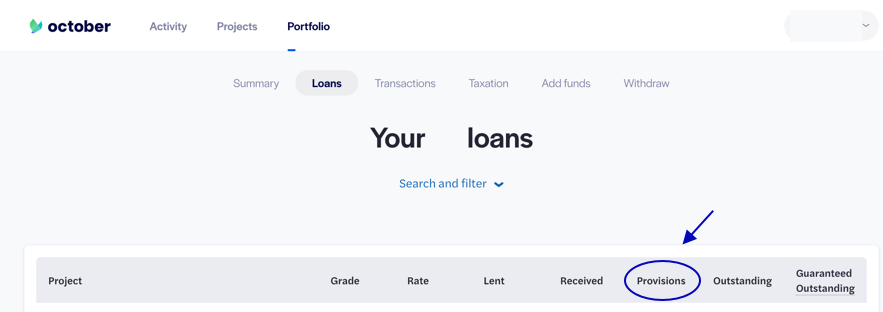
Another indicator to know that you have a default in your portfolio is a provision. You can check the amount of provisions by going into your loans.
Provisions will be applied to your projects in default to give you a better overview of your portfolio, they are not real losses, only an estimation of the capital considered as lost at that moment. Learn more about how provisions are applied here.
By sharing all our processes, our statistics, and our default rate, we want to build a trusted relationship with you and give you all the resources you may need to build your ideal portfolio.