In 2021, we launched a survey among our lender community to know the topics they were eager to learn more about. One topic came back over and over: our statistics. To answer all your questions related to statistics, we have launched a series of articles called October’s Data Dive.
In this second article of the series, we will focus on a relevant statistic for lenders: the Internal Rate of Return (IRR). We will take a closer look at what is it, the main differences between the Initial and the Actual IRR and how IRR can help you understand the health of your portfolio.
What does IRR stand for?
As a retail lender, understanding the performance of your portfolio is key to monitor your investments and adjust your diversification strategy. The Internal Rate of Return (IRR) is one of the most pertinent data to help you with that.
But what is the IRR exactly? It’s a financial tool used to measure the profitability of potential investments and compare the attractiveness of each of them. On your October’s portfolio, the IRR basically tells you if your portfolio is profitable or not.
The IRR is the net annual return earned by the lender over a period of time and calculated on the basis of the incoming and outgoing cash flows. In the case of October loans, the IRR takes into account the dates of all your investments, the monthly repayments, possible rescheduling and the potential defaults and express all these cash flows as an annual return. Also, the IRR can be calculated for a particular loan but is a powerful metric to express the return of your portfolio as a whole.
The portfolio is compound by 2 types of Internal Rate of Return, the Initial IRR and the Current IRR. Both may vary even when you don’t have any defaults in your portfolio. We will go into details about these 2 types in the next paragraph.
What is the difference between the Initial and Current IRRs presented on October?
There are two Internal Rate of Return on the October’s portfolio. The difference between both of them is quite simple:
- The Initial IRR, represents the annual return of your portfolio without any default, rescheduling or early repayment.
- The Current IRR is an adjusted view of your portfolio. It shows the annual return after taking into account the defaults, early repayments and rescheduled loans you may have in your portfolio.
This way, you can always have an updated view of the health of your investments and the impact of your loans’ status on your October’s portfolio.
Where can I check the IRR of my portfolio?
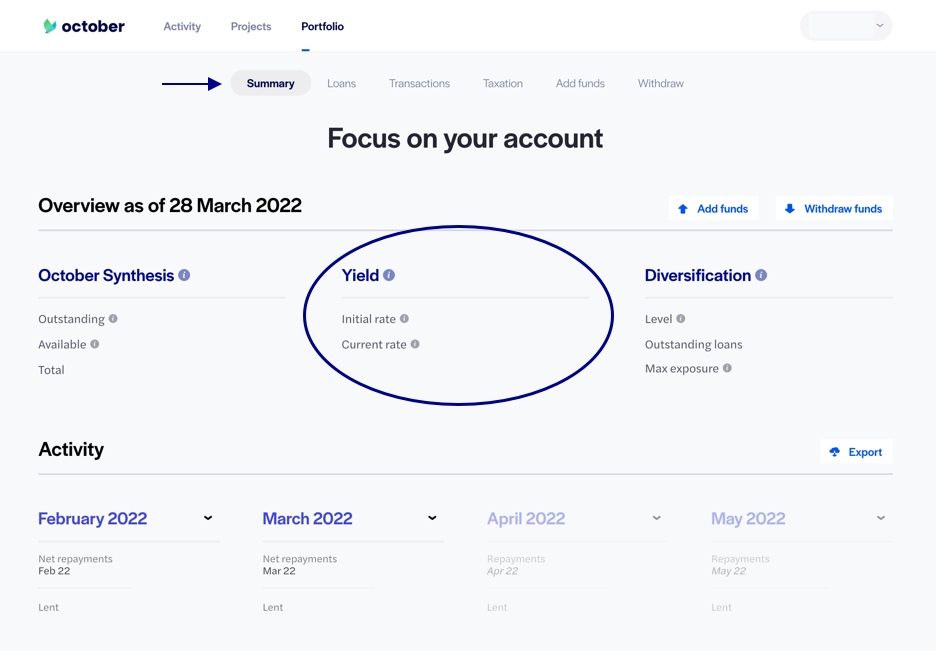
You can find the Initial and Current IRR in the Summary tab of your portfolio under the section “Yield”. It’s available whenever you need it and it’s always updated, so every time you lend to a project or you have a default and a provision has been applied, the data will automatically change.
You need to take into account that the IRR of every project is not displayed on the portfolio. You can calculate it from the the excel with your past and future repayments that is available on the button “Export” on the Summary page. To know how to calculate the IRR, take a look at our tutorial.
Where to find the global performances of October’s portfolio and how to read them?
Now that we’ve seen how to monitor your own IRR, let’s take a closer look at the performance results table on October’s statistic page. On this page, you can find at any moment all the statistics related to the October portfolio.
As of 31/03/2022
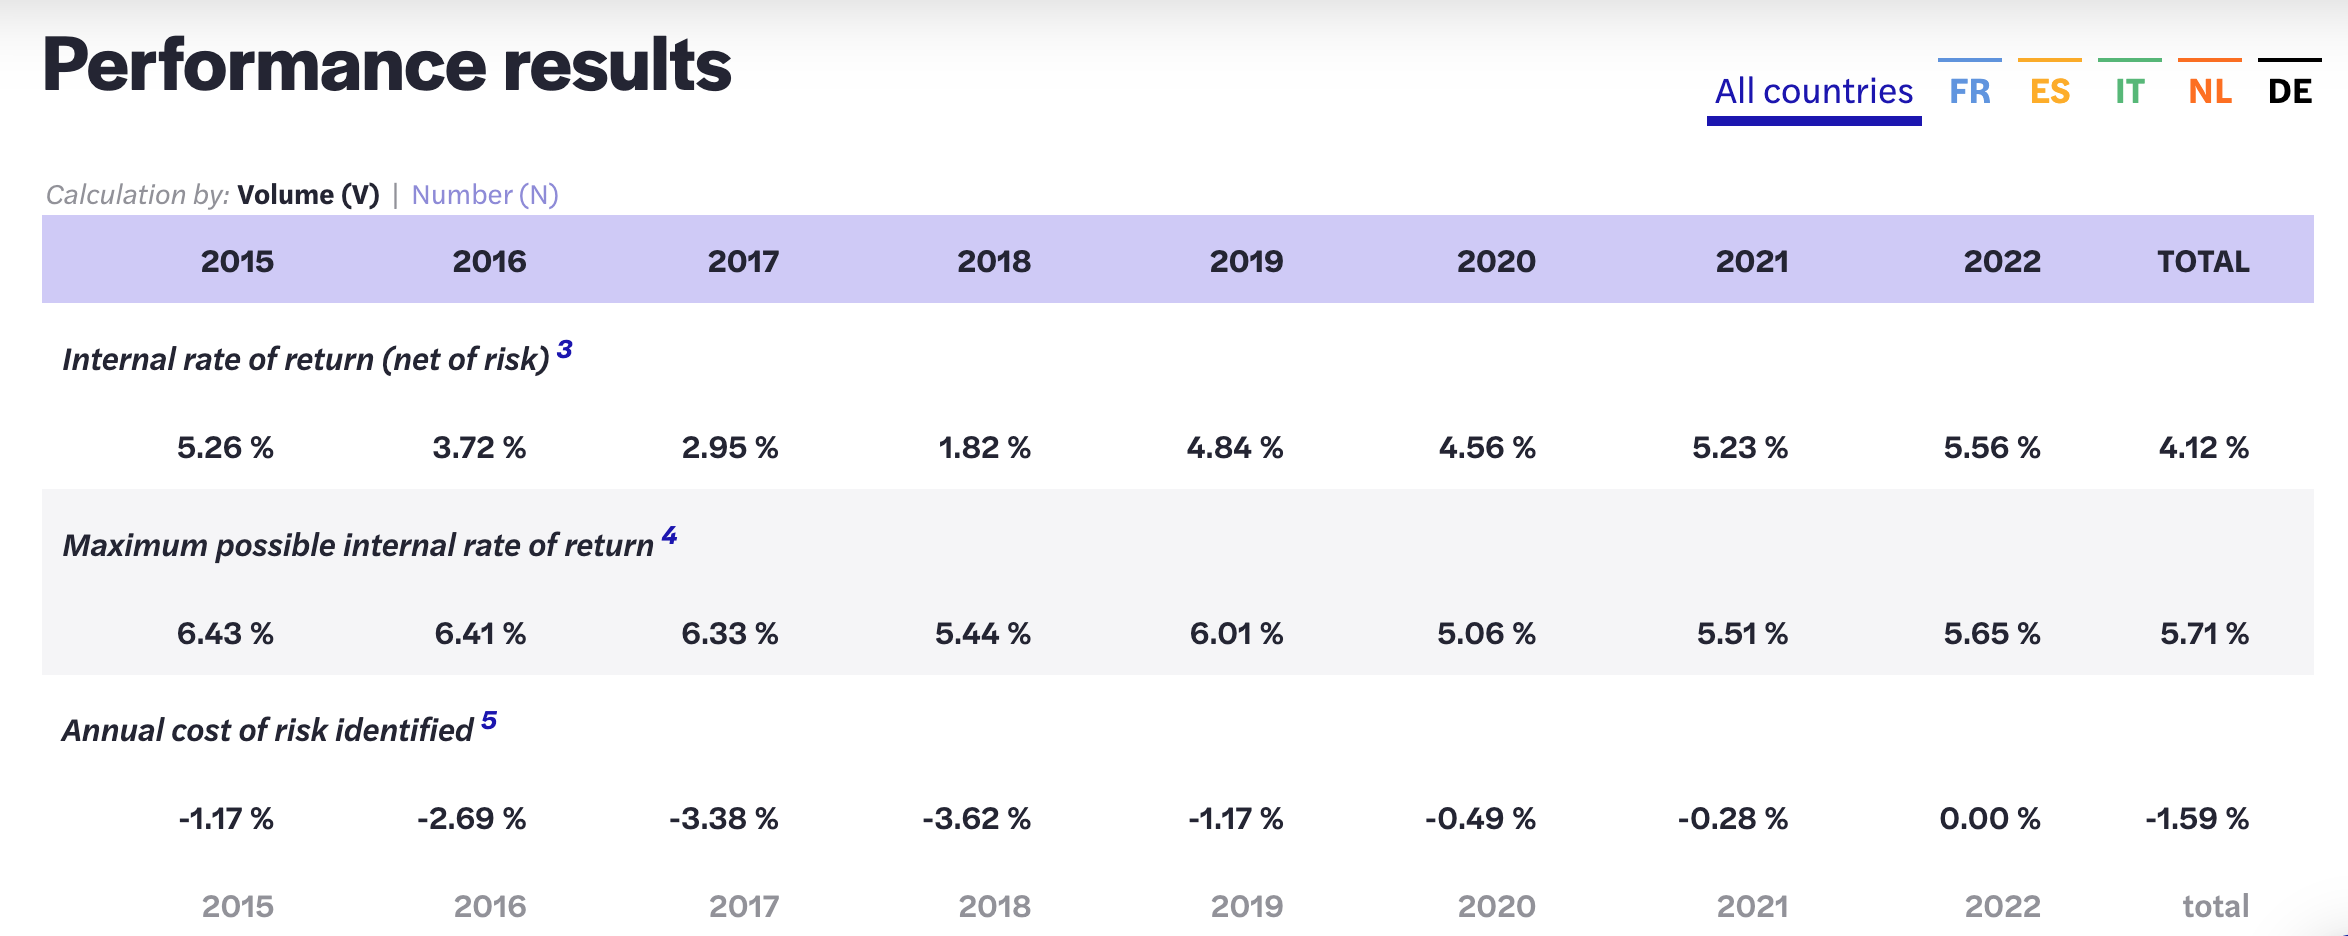
In the performance results table, you can find:
- The internal rate of return (net of risk) in the table corresponds to the definition of the current IRR presented above. It’s the IRR adjusted from incidences and early repayments.
- The maximum possible internal rate of return is the equivalent of the Initial IRR. It’s the annualised return on loans if they were repaid as originally scheduled.
- The annual cost of risk represents the impact of defaults on the portfolio. It compares the initial IRR with the current one. The lower it gets, the more defaults affect the profitability of the portfolio.
As of February 2022, you can see that, for a portfolio made of all the projects ever published on October, the internal rate of return (IRR) post-defaults is of 4.12% (vs. an IRR before default of 5.71%). This means that the global impact defaults on the internal rate of return is 1.59 points.
If we analyse this performance table per year, we can see that the current IRR decreased in 2016-2018 before stabilising above 4% from 2019 and reaching 5,56% in 2022. Even though defaults are expected as part of a matured portfolio, we have been focusing since 2019 on learning from incidences, especially early defaults, to improve our scoring models and our identification of fraud patterns. With the introduction of Instant Projects in 2020, we also lowered the average size of the loans presented on the platform, reducing at the same time the impact a default might have on the global performance of the portfolio. In our next article dedicated to the default rate, we will deep dive into this subject.
Now, looking at the IRR per country, we can see that the current IRR varies from 3,47% in France to 5,86% in the Netherlands, Italy and Spain being around 4,5%. The maturity of the portfolio, the market in which we evolve and the types of loan products we can offer varies from country to country and should be taken into account to assess the initial and current IRRs. So far, the best annual cost of risk can be found in The Netherlands, with -0,04% on the global period.
The IRR: the most important performance data
To really evaluate October’s performance and the possible performance of your portfolio, the IRR is more representative than the default rate. Why?
1. Defaults rates don’t take into account projects repaid without any defaults
At October, retails lenders are advised to look at the IRR instead of the default rate to analyse the performance of their portfolio because the default rate assess October’s performances but the total outstanding (denominator) does not include all the projects that have repaid their loans without impact, while the numerator includes all the projects in default. Thus, based on the current outstanding amount, the default rate based on the scoring system is of 8,90% based on the number of projects. However, if the denominator included the total number of projects, this data would be lower. We will take a closer look at the calculation of the default rates in the next statistics article.
That is why the most interesting statistic to analyse the impact of defaults on the October portfolio is the IRR (net of risk) and to compare it to the maximum possible IRR.
2. Having defaults doesn’t mean your portfolio is not healthy
The second reason why the IRR is the most relevant statistic for lenders is because defaults don’t defined the health of your portfolio. Of course, lending comes with a risk of losing your outstanding capital but you can have defaults and still have a profitable portfolio.
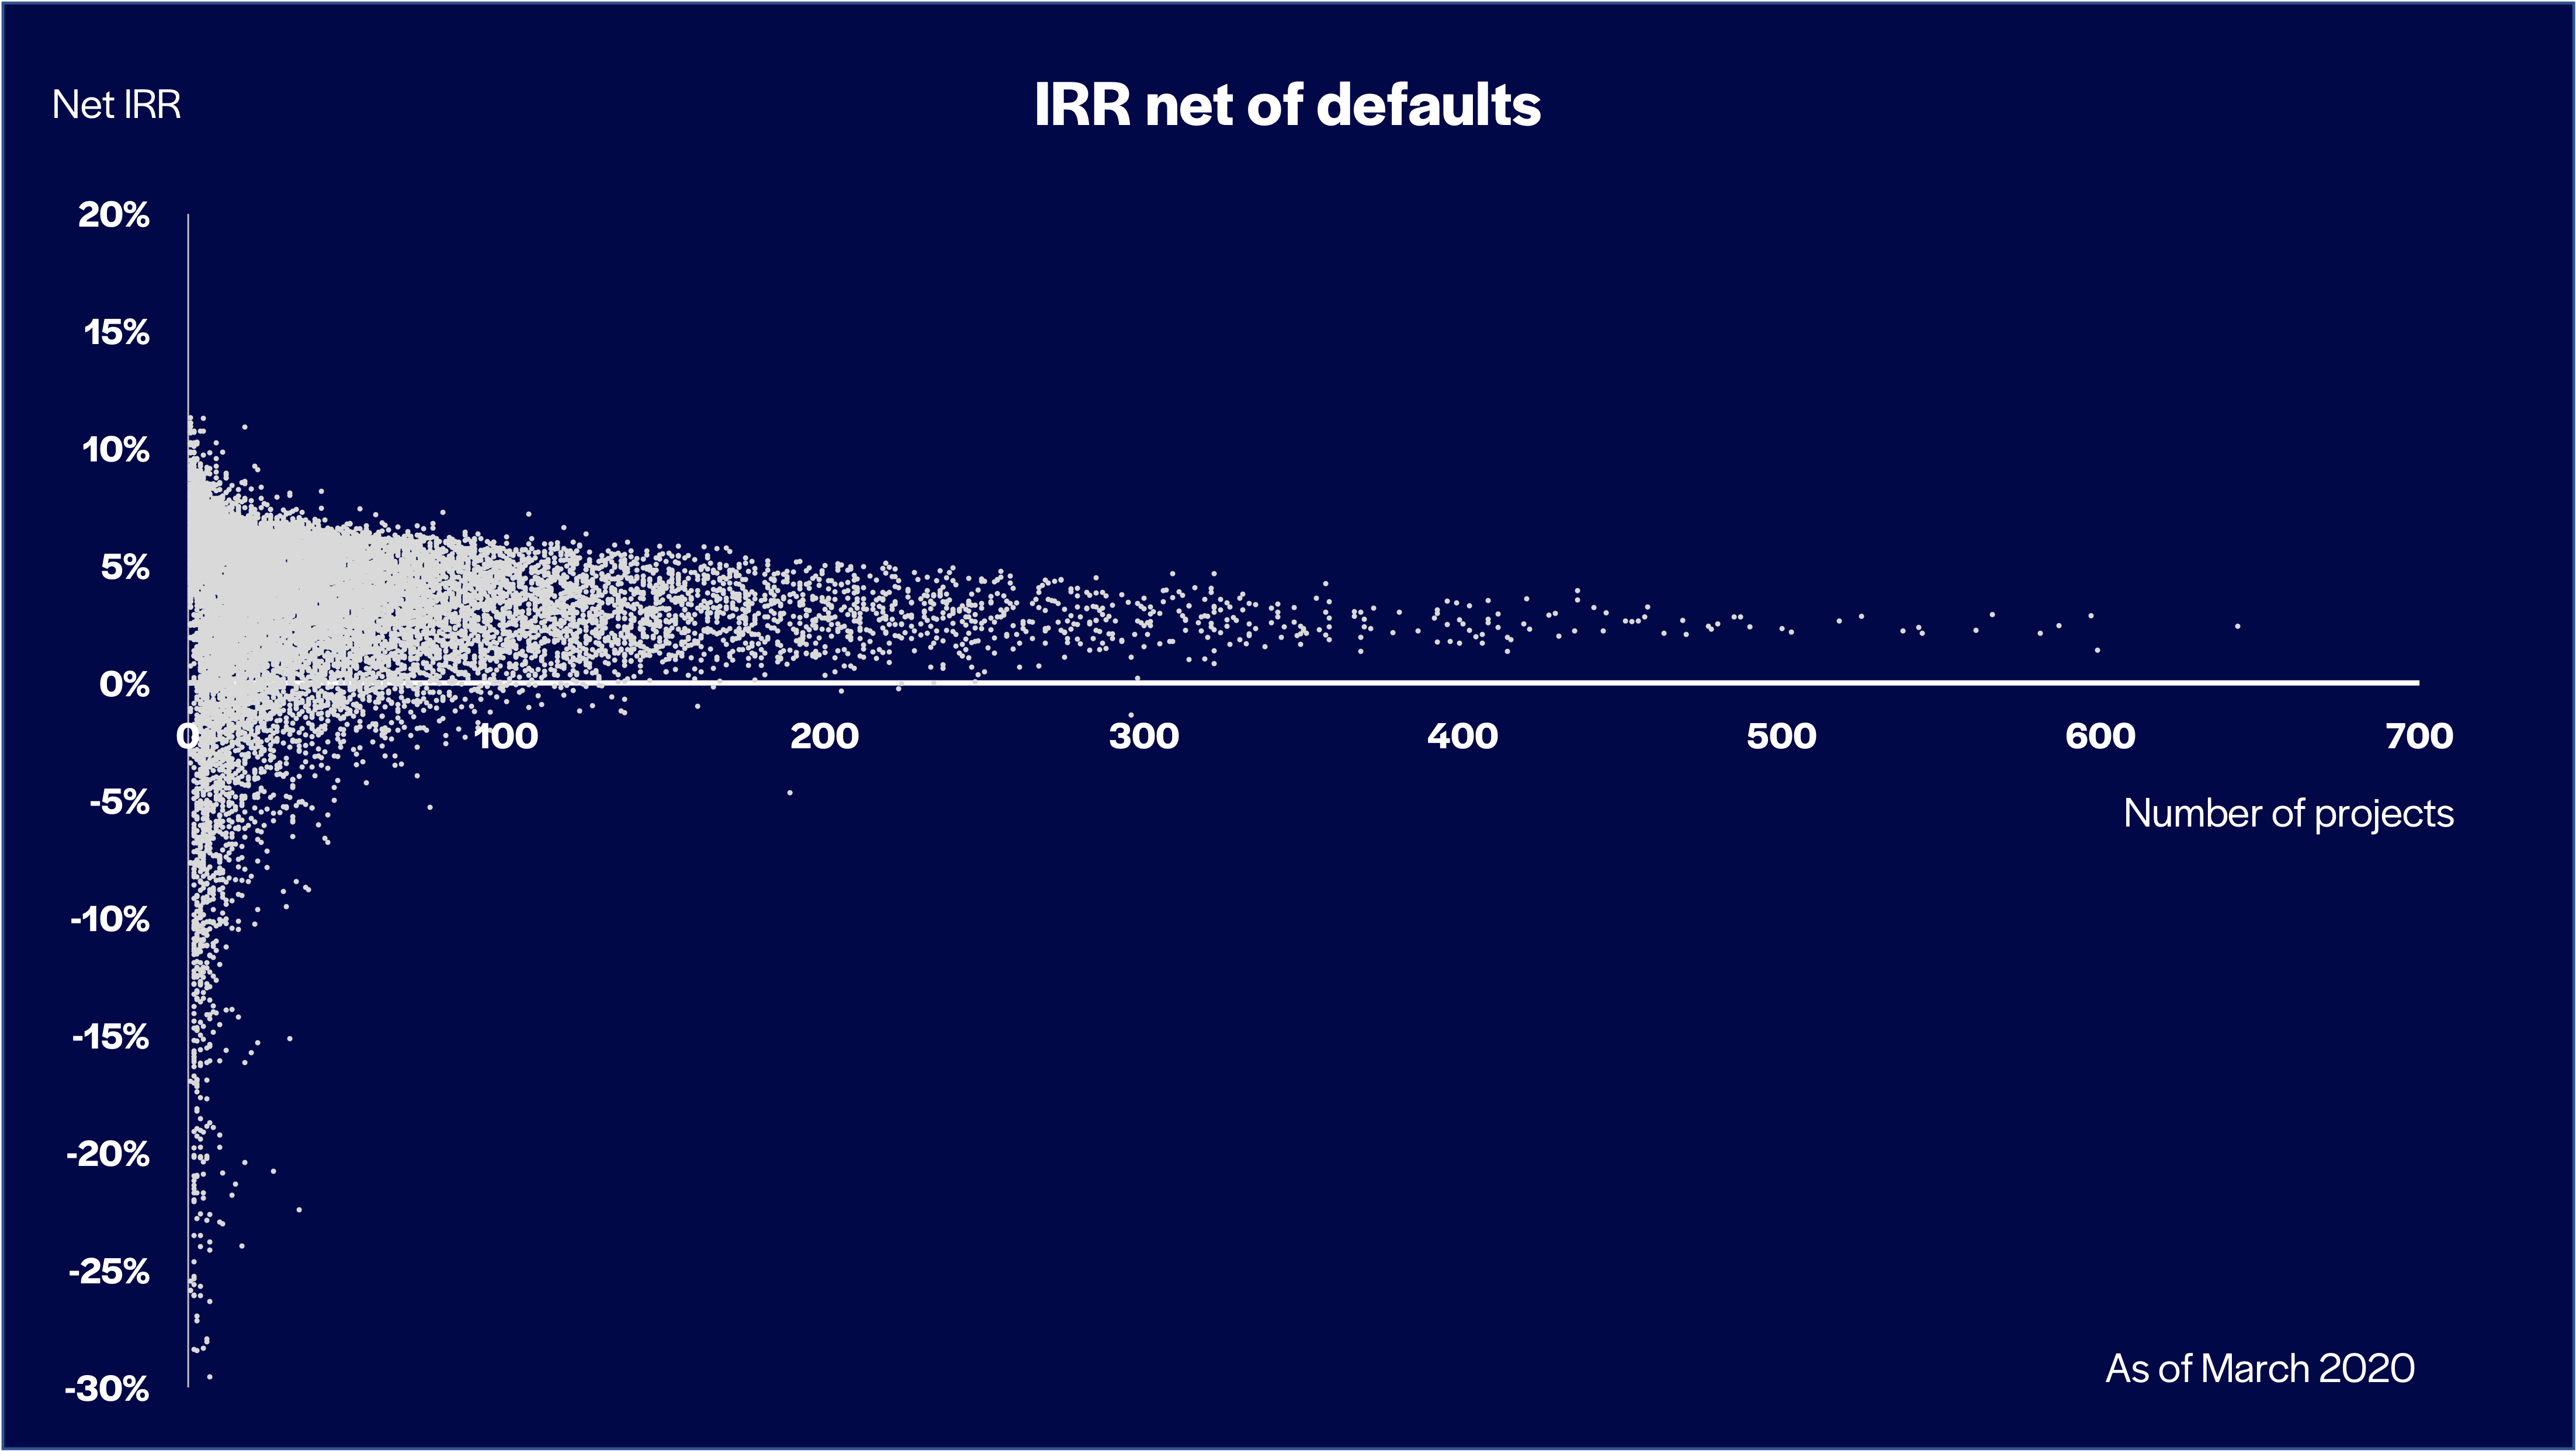
This is why we insist on the diversification of your portfolio. Diversifying allows the yield of your portfolio to be more stable. As a result, the impact on the return in the event of a default is smaller and the loss of capital is less significant. You can have some defaults on your portfolio and have a positive IRR. Based on our analysis, the IRR stabilises after lending to 100 loans.
Find below a table of the diversification of the portfolio. The more project of the same amount lent are in your portfolio, the more defaults won’t affect your profitability.
That is how you keep your portfolio healthy and your IRR positive.