Last year, we launched a survey among our community of lenders to gain a better insight into the topics they were eager to learn more about. One topic came back repeatedly: our statistics.
In this blog post, we continue with the fourth article of our series October’s Data Dive. We will focus the key figures of our loans. We will take a closer look to how credit analysis works and how one loan differs from the next.
Understanding the loan process
Companies from France, Spain, Italy, The Netherlands and Germany come to October with diverse reasons, for example to finance their growth projects, to diversify their sources of financing or to have a complete online process without all the traditional paperwork.
In our key figures you can see that over the last 8 years, more than 188,274 companies have requested a loan through October. Out of these, only 3,518 companies have been granted a loan. Through credit analysis we determine a company’s ability to repay the loan they request. The goal of our analysis is to assign a risk score to the request and determine the right interest rate for the respective level of risk.
How do we approach credit analysis at October? A borrower’s request will be assessed using 1 of the 2 different types of credit analysis that we employ. What are they?
- Standard projects analysis
The credit analysis for our standard projects is characterised by a human touch. The credit analysts assigned on the deal is responsible for gathering the quantitative and qualitative information necessary to assess the risk of a project. They dive into the request, talk to the people in the company and assess whether to ask for securities. The result of this analysis is a custom loan offer, specific to the request. Please read our dedicated tutorial to know all about this type of credit analysis.
- Instant projects analysis
The instant projects are analysed with one of our automated risk scoring models based on financial and behavioural information (Magpie) or based on bank transactions (Kea). That allows us to make a faster credit decision. The result of this analysis is a standardised loan offer up to €250,0000. The human touch is less, because the analysts are only involved in antifraud and compliance checks.
The interest rate: How is it determined and where to find this data?
But we’re not there yet. Probably, you are wondering how we decide the interest rate of a project. After all, this directly affects the possible return on your investments.
Credit analysis helps us estimate the risk attached to granting the loan. We have designed a credit score to rank that risk. The credit score goes from A+ to C-(from high to low creditworthiness). The interest rate is a reward for the risk and thus, you’ll see a higher interest rate for projects with a higher risk. The other variables that complete the interest rate are the duration of the loan (the longer the duration, the higher the interest rate) and the central bank rates.
On our statistics page we record the average interest rate per year under the general indicators on our statistics page. As with any of our stats, you can filter the numbers by country and view them by volume or by amount.
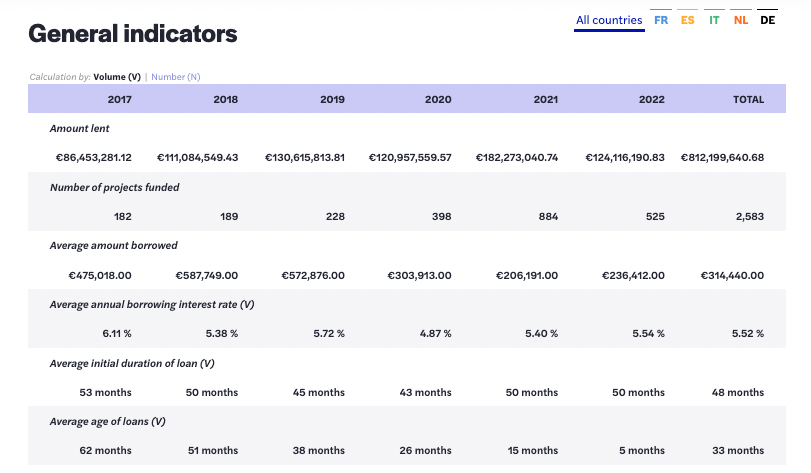
The average interest rate evolves through the years and depends on the rate of all loans combined that we distribute during any given year. 2020 is a great example: during this year we have distributed a lot of state guaranteed loans to help companies survive the COVID-19 crisis. These projects typically had a lower interest rate than projects without a state guarantee, so the average interest rate of the loans distributed in 2020 is lower than in the previous years.
Now, in 2022, most of the state guaranteed loans have come to a stop and the central bank interest rates have increased. This has lead to a higher average interest rate compared to the past 2 years.
The key figures of October’s loans
Since the beginning of October, 8 years ago, a lot of projects have been supported by our Lenders community. These projects ranged from buying a new office, to the digitalisation of business processes and from international expansion, to efforts to decrease the company’s ecological impact.
The key figures of our loans are the first thing you see when you enter the statistics page. Regardless of their purpose, all the projects we finance are summarised within these indicators of our portfolio. What can these key figures tell you about our portfolio?
- 3,518 projects have been accepted and funded on our platform, for a total amount of €812,199,621.
- €491,035,755 has been repaid to the lenders, including €63,744,756 interest. Whereas above we looked at our interest rate, in this section you can see the absolute amount of interest repaid to lenders.
- In terms of countries, 2,078 loans come from 🇫🇷 France, 978 from 🇮🇹 Italy, 153 from 🇪🇸 Spain, 231 from 🇳🇱 The Netherlands and 78 from 🇩🇪 Germany.
You can use all these different loans to build your own portfolio. The portfolio page within your account is basically your own statistics page with its own distribution among countries, sectors, etc. And its own average interest rate. Learn how you can use diversification to your advantage.