At October, we offer our lenders the possibility to lend to French, Spanish, Italian and Dutch projects. The same lending process applies to all these projects: within a few clicks, a lender selects a project of their choice and determines how much he or she wants to lend, regardless of the country-origin of the project. This is what we call the Europe of Savings: a European community of lenders investing directly in the European real economy.
It is interesting to see the difference between lenders from different nationalities. Is there any country they prefer to invest in over the others? Is the risk appetite different from one country to another? It has been a while since we gave insights into these statistics. To be more precise, our last update was in March last year (when we were still named Lendix…)! Not only our name has changed. There have been some shifts in our statistics too #teasing
Time for growth
In 2018, October expanded internationally and became even more European with the launch of October in the Netherlands. Since then, there have been 14 Dutch projects for a total amount of €5.5M. This enables our lenders to diversify their portfolio over 4 countries.
Our community of lenders has expanded as well. Back in March 2018 11,000 active* private lenders invested in October projects. As of this month, we have over 17,000 active lenders. The largest part of our community is French. 85% of the community is from the country where we first started. Approximately 5% is from Spain, 4% is from Italy and less than 1% is from the newest October country, the Netherlands. The remaining part of the community consists of lenders from other countries, mostly expatriates.
*An active lender is a lender who has invested in at least one project.
The preferences
So far, the community has provided 552,300 loans, with an average amount of €102.38 per loan (as of May 2019). This means that the community of private lenders has invested over €58 million directly in the European real economy.
Risk appetite
Do our lenders like to take risk? For this, we looked at the average amount lent per project. It turns out that A rated projects are most popular among our lenders, except for the Dutch lenders. In the Netherlands, A+ projects are the most popular. This is in line with the trend that we see in our data: the average loan to relatively low-risk A+, A or B+ rated projects is approximately 10% higher than to more risky B or C rated projects.
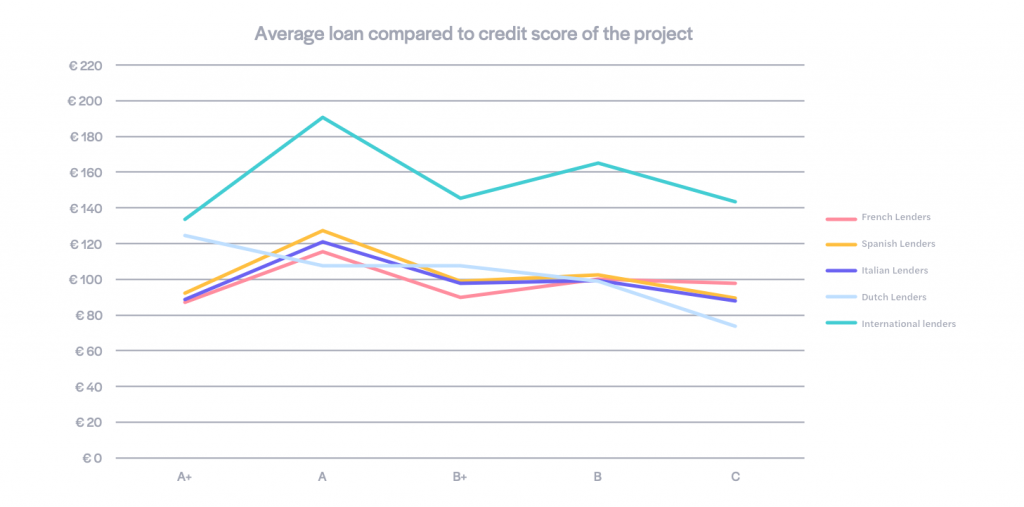
2 countries stand out: France and the Netherlands. French people do not seem to have a preference; their average loans between low- and high risk projects are nearly the same. Dutch do seem to have a very strong preference. They lend 24% more to A+, A or B+ rated projects. This implies that French lenders are more risk-taking than the average October lender, while Dutch lenders are more risk-averse.
The international lenders stand out as well. On average they lend a higher amount to all types of projects than lenders from France, Italy, Spain or The Netherlands.
Duration
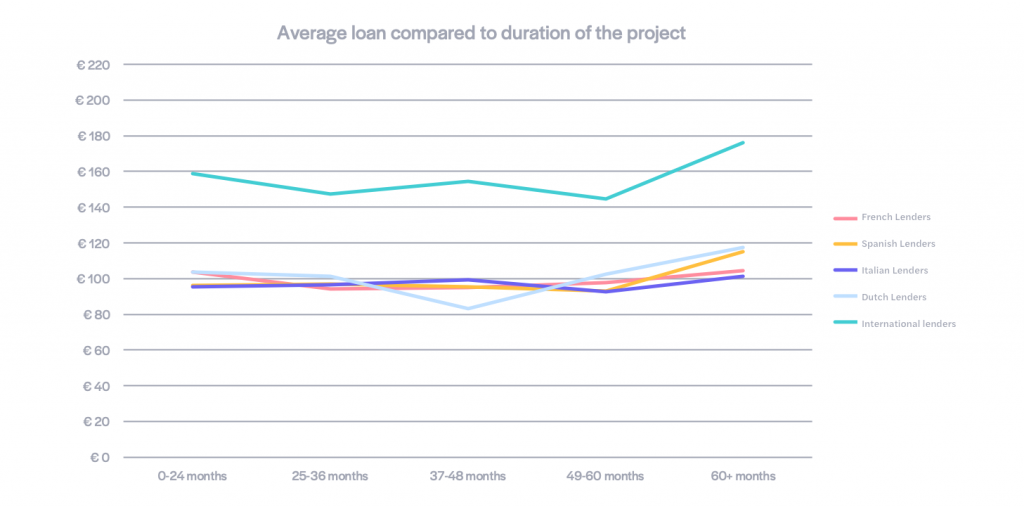
Do our lenders have a preference for the duration of a loan? When we look at the duration of the projects that our lenders lend to most, we see an interesting trend. Lenders seem to like either very short, or very long projects. In all countries lenders lend almost €123 to projects with a duration of more than 60 months, whereas they lend on average €105 to projects with a duration between 36 and 48 months.
Country
In March 2018 we wrote “Home is where my loans are”. Is this still true? Well, yes and no. On average, French, Spanish and Italian lenders lend 15% more to projects from their home country. French are the most drawn to projects of their home country: they lend 21% more to French projects. Of course, most projects on the platform are French, so they have a lot of projects to pick from. Possibly this is also why for Dutch people it’s the other way around. They lend 15% more on average to projects from countries other than the Netherlands.
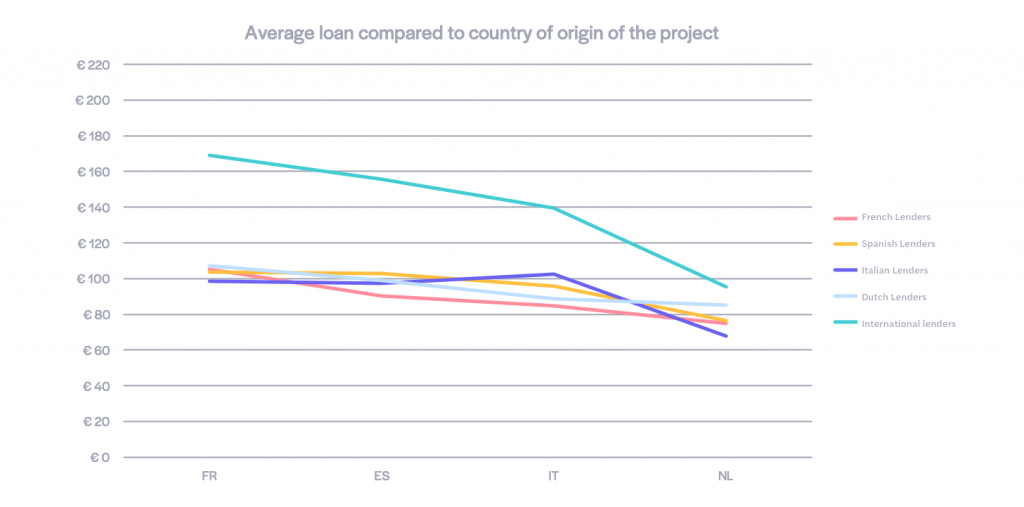
What is also interesting is that the October community lends the lowest average amount to Dutch projects. How is that possible? It is too early to say something about this. In this data set there are just a few Dutch projects. With more Dutch projects following, we expect the amount that people lend to Dutch projects to move closer to the average. Maybe people are testing out the Dutch projects, before funding more.
Why lend to different types of projects?
The answer is simple: to diversify your portfolio and reduce the risk. With diversification, a lender spreads her or his investment over several smaller loans. As a result, the impact on the return in the event of a default is less significant and the loss of capital is smaller. When an investor spreads the investment over several sectors, risk categories and loan maturities, the portfolio is also less dependent on the economic status of a country or sector.
Where can I find more statistics?
Once in a while we comment on statistics like these and write a blog about it. But, we have more. Every month we update our performance statistics on the website, so that you have a full and transparant insight in our performance and that of our portfolio. Think of: the average return, the average loan duration, which sectors, the amount of lenders, etc. Everything you need to know.